
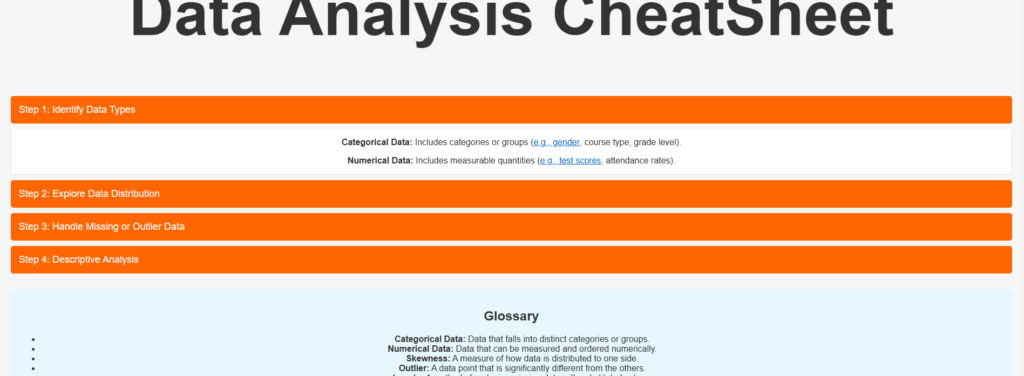
This Data Analysis CheatSheet project aims to make data analysis accessible to beginners through a clear and structured approach. The website (https://codepen.io/Ying-Zhang-the-reactor/full/oNKdWxL) is now live and provides a step-by-step guide to essential data analysis tasks, including identifying data types, exploring data distribution, handling missing or outlier data, and conducting descriptive analysis. Each section breaks down complex concepts into beginner-friendly explanations, with clickable links and examples for deeper exploration. The user interface is designed to prioritize simplicity, ensuring an intuitive experience for those new to data analysis.
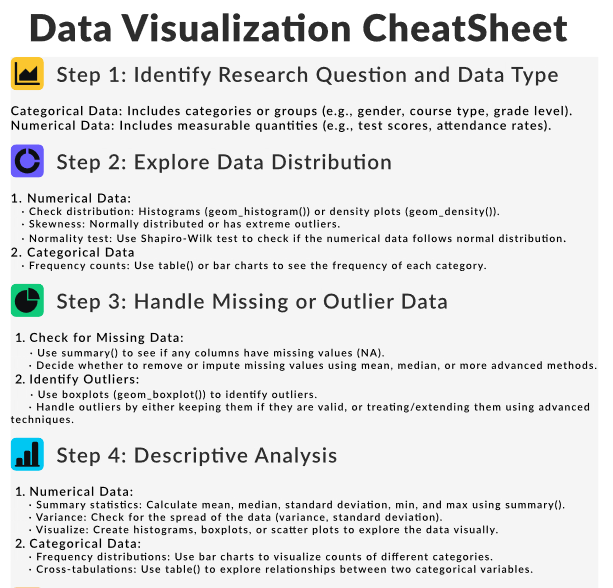
To complement the website, I’ve developed an A4-sized CheatSheet using Figma. This one-page resource condenses the key points from the website into a printable, visual guide. It includes definitions of essential terms like skewness and outliers, practical tips for common tasks, and examples of tools such as boxplots and summary statistics. The Figma CheatSheet provides learners with a quick-reference tool they can use offline or alongside their projects, making it a valuable addition to the overall learning experience.
Throughout the process, balancing simplicity with accuracy has been a key challenge. Similar to other projects that simplify complex ideas for their audiences, I’ve had to carefully refine the material to ensure it remains accessible without losing depth. Collecting feedback from users has been an invaluable part of this process, providing insights into how the CheatSheet and website can be further improved to meet learners’ needs.